by Michele Cooke (UMass Amherst)
Jun 17, 2025
What is the energy budget of subduction zone hazards?
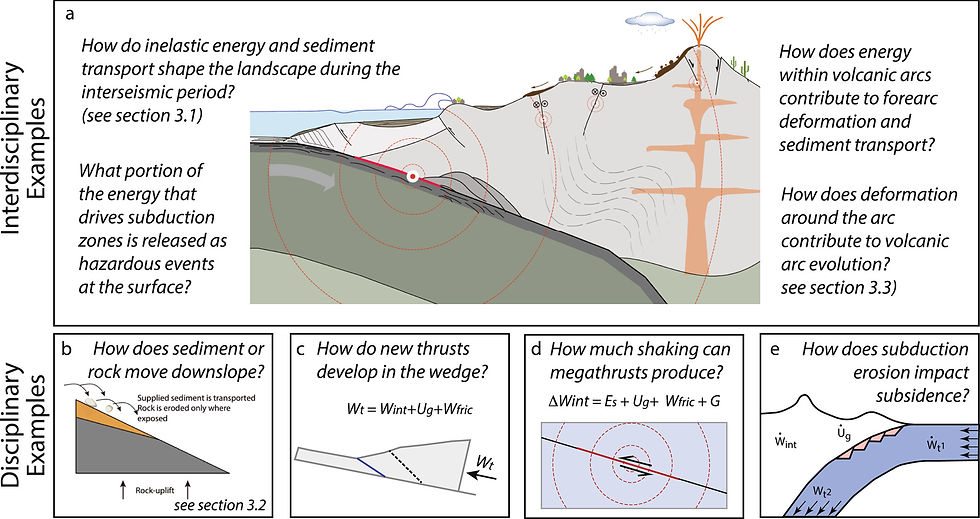
Subduction zones host some of the largest and most devastating geohazards on Earth. The magnitude of these hazards is often measured by the amount of energy they release over short periods of time, which in turn depends on the amount of stored energy available for the geologic processes that drive these hazards. By considering the energy transfer among processes within subduction zones, we can identify the energy inputs and outputs to the system and estimate the stored energy. Due to the complex, multiscale nature of subduction zone processes, developing an energy budget of subduction zone hazards requires integrating a wide range of geologic and geophysical field, laboratory, and modeling studies. In this work, we present a framework for developing mechanical energy budgets of upper crustal deformation that considers processes within the magmatic system, at the subduction zone interface, distributed and localized deformation between the arc and trench, and surface processes that erode, transport, and store sediments.
The subduction energy budget framework provides a means to integrate diverse datasets and model results, allowing for the exploration of interactions among various processes. Because fault mechanics, sediment transport and magmatic processes within subduction zones do not act in isolation, we gain insights by considering the common energetic elements of the subduction zone system. Framing the energy budget requires integrated thinking about processes that go beyond, for example, mass balance, or strain budget, and reconsidering the relevant observational constraints in a different, and more integrated way. Constructing energy budgets reveals gaps in our understanding of subduction zone processes, highlighting opportunities for new interdisciplinary research that can inform hazard potential.
This idea for this project emerged from the SZ4D Landscape and Seascapes working group discussions and was made possible by the SZ4D Research Collaboration Network. We have not “solved” the energy budget of subduction zone hazards; rather, our goal is to energize new directions for interdisciplinary research that will help us understand subduction zones and the hazards they produce.
Cooke, Michele L., Juliet G. Crider, Kristin D. Morell, Leif Karlstrom and Brian J. Yanites, 2025, What is the energy budget of subduction zone hazards?, Reviews of Geophysics, 63, e2024RG000848. https://doi.org/10.1029/2024RG000848